


The cyclical nature of financial markets manifests as a reflection of collective investor psychology and behavioral patterns. In particular, the period encompassing the last two weeks of the year and the first week of the new year represents a unique timeframe for market participants, characterized by both high opportunity and unpredictable risk. At ewplans.com, we analyze this process through the mathematical discipline of Elliott Wave Theory (EWT) and the harmonic depth provided by Fibonacci ratios. These "uncertain movements" are actually the result of a complex psychological structure shaped by low liquidity, tax-driven portfolio adjustments, and the motivation of a "fresh start". This report examines the volatility mechanisms of the year-end transition period in light of scientific literature and technical analysis principles.
Foundations of Elliott Wave Theory and the ewplans.com Methodology
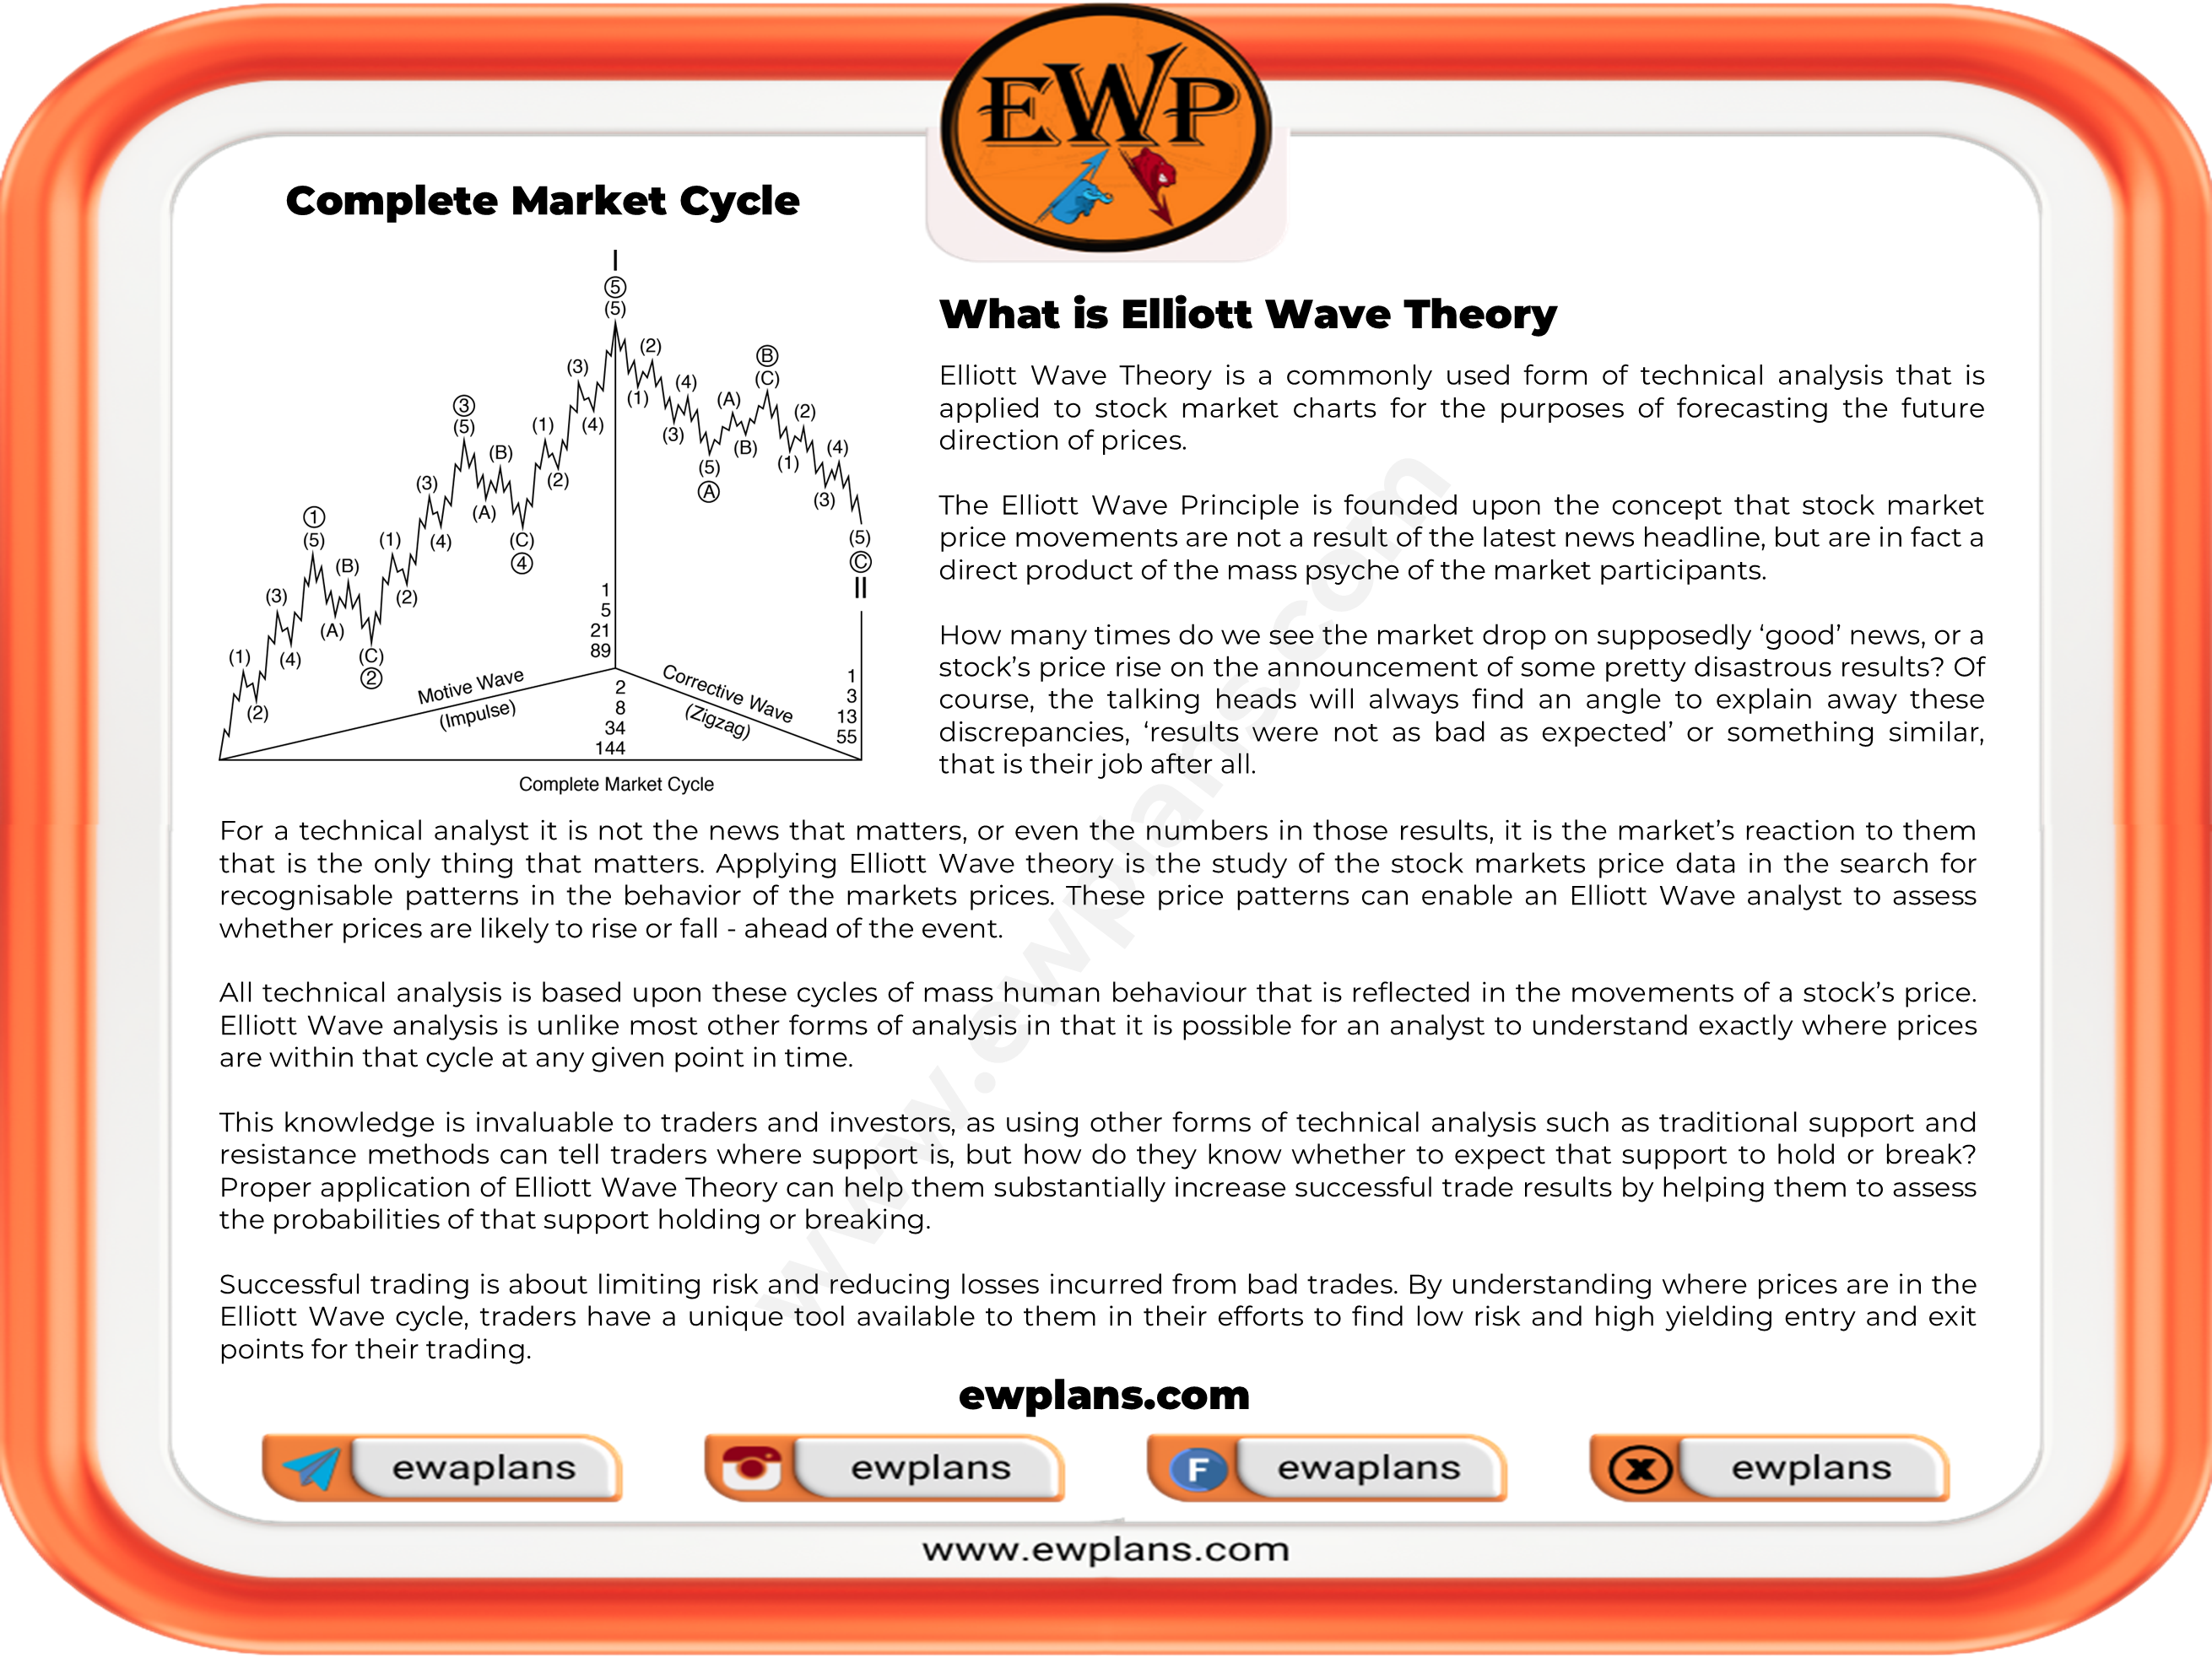
Elliott Wave Theory, developed by Ralph Nelson Elliott in the 1930s, posits that market movements are not random but progress according to specific rhythms and structures. The ewplans.com approach of "math meets market magic" adapts this theory to modern financial instruments, providing deep analysis across parities, indices, commodities, and crypto assets.
Wave Principles and Fractal Structure
Elliott observed that markets move in a cycle of five-wave impulses (motive waves) and three-wave corrections. A fundamental characteristic of these waves is their fractal nature; a five-wave structure on a one-hour chart is merely a sub-component of a much larger wave on a daily or weekly chart. Year-end uncertainties often coincide with points where these wave degrees overlap or where a trend reaches exhaustion.
|
Wave Type |
Characteristic Features |
Psychological Background |
|
Wave 1 |
Initial move; usually met with skepticism. |
Entry of contrarian investors. |
|
Wave 2 |
Deep retracement; cannot exceed start of W1. |
Fear and profit-taking. |
|
Wave 3 |
Strongest and longest; supported by high volume. |
Mass adoption of the trend. |
|
Wave 4 |
Complex and shallow correction; no overlap with W1. |
Indecision and consolidation. |
|
Wave 5 |
Final impulse; often ends with momentum divergence. |
Extreme optimism and FOMO. |
|
Correction (ABC) |
Three-wave structure against the main trend. |
Trend change and revaluation. |
In the ewplans.com analysis style, 4-hour charts are updated daily to capture short-term opportunities, while daily charts serve as the foundation for medium-term strategies. During the year-end period, consistency between these periods is critical for distinguishing false breakouts from genuine moves.
Seasonal Anomalies: The January Effect and Santa Claus Rally
Academic literature refers to "calendar anomalies" as phenomena that provide strong evidence against the efficient market hypothesis.
The January Effect
The January Effect is the tendency for stock prices, particularly small-cap companies, to rise more in January than in other months. The leading scientific explanation is the "Tax-Loss Harvesting" hypothesis. Investors sell losing positions at year-end to reduce tax liabilities and reinvest that capital in January.
Furthermore, the influx of year-end bonuses and the creation of new investment plans for the year provide a significant cash injection in early January. ewplans.com analyses closely monitor how this cash flow triggers Elliott impulse waves, particularly Wave 1 or Wave 3.
The Santa Claus Rally
The Santa Claus Rally refers to a seasonal uptrend typically occurring during the last five trading days of December and the first two trading days of January. Historically, the S&P 500 has gained an average of approximately 1.3% during this period with a success rate of nearly 79% since 1950. If this rally fails to materialize, it is often considered a technical sign of weakness, colloquially noted as "if Santa doesn't call, the bears will visit Wall Street".
|
Period Analysis |
Start - End |
Avg Return (S&P 500) |
Historical Success Rate |
|
Santa Claus Rally |
Dec 24 - Jan 3 |
1.3% - 1.4% |
79% |
|
January Barometer |
Full January |
Variable |
75% (Predicts year direction) |
|
First 5 Trading Days |
Early January |
1.1% |
70% |
Market Microstructure and Liquidity Contraction
The primary technical reason for year-end uncertainty is the drying up of liquidity. Research shows that trading volumes in the final week of December typically fall between 40% and 70% below normal levels.
Impact of Low Liquidity on Price Action
Low liquidity means reduced market depth. Consequently, even small orders that would normally have no impact can cause sharp and unbalanced price movements. The effects on Elliott Wave counts include:
- Sharp Spikes and Gaps: Price may jump from one level to another due to liquidity gaps, potentially leading to violations of Elliott rules, such as waves overlapping.
- Widening Spreads: The gap between bid and ask prices widens, triggering stop-loss orders prematurely and creating bull or bear traps.
- News Sensitivity: Minor economic data can have a disproportionate impact, mimicking the effect of major FOMC decisions due to the lack of active participants.
Volatility Mechanics and GARCH Modeling
In finance, volatility is measured as the logarithmic standard deviation of returns (σ). During the year-end period, volatility exhibits "seasonal heteroskedasticity". GARCH (Generalized Autoregressive Conditional Heteroskedasticity) models reveal that volatility clustering during December and January directly affects the market's risk perception.
Mathematically, volatility can be expressed as:
σt2=α0+α1ϵt−12+β1σt−12
Here, ϵt−12 represents past shocks. In a low-liquidity holiday environment, even a small shock (ϵ) can disproportionately increase the variance (σ2).
Critical Elliott Wave Formations and Year-End Applications
The year-end market structure provides ideal conditions for specific Elliott formations, most notably "Ending Diagonals" and "Complex Corrections".
Ending Diagonal
An ending diagonal is a terminal pattern that typically appears at the end of a 5th wave or a C wave, signaling trend exhaustion. It has a 3-3-3-3-3 internal structure and appears as a wedge. During holiday trading, cilliary price moves with momentum divergence (RSI) often form this pattern.
- Significance: Once completed, price usually reverses sharply back to the point where the diagonal began.
- Year-End Connection: Weak rallies in late December often form these diagonals, serving as a precursor to sharp sell-offs in the first week of January.
Complex Corrections and Sideways Movement
When market direction is unclear in late December, prices often get trapped in "Flat" or "Triangle" structures.
- Expanded Flat: A structure where Wave B exceeds the start of Wave A and Wave C exceeds the end of Wave A, resulting from high volatility and lack of liquidity.
- Running Flat: Occurs when the underlying trend is so strong that the correction cannot pull back fully. This is often a signal of strong upward momentum expected in January.
|
Pattern Type |
Internal Structure |
Location |
Expectation |
|
Impulse |
5-3-5-3-5 |
Main Trend |
Continuation |
|
Zigzag |
5-3-5 |
Correction |
Sharp Retracement |
|
Flat |
3-3-5 |
Consolidation |
Sideways Movement |
|
Ending Diagonal |
3-3-3-3-3 |
End of Trend |
Sharp Reversal |
|
Triangle |
3-3-3-3-3 |
Wave 4 / Wave B |
Pause Before Final Push |
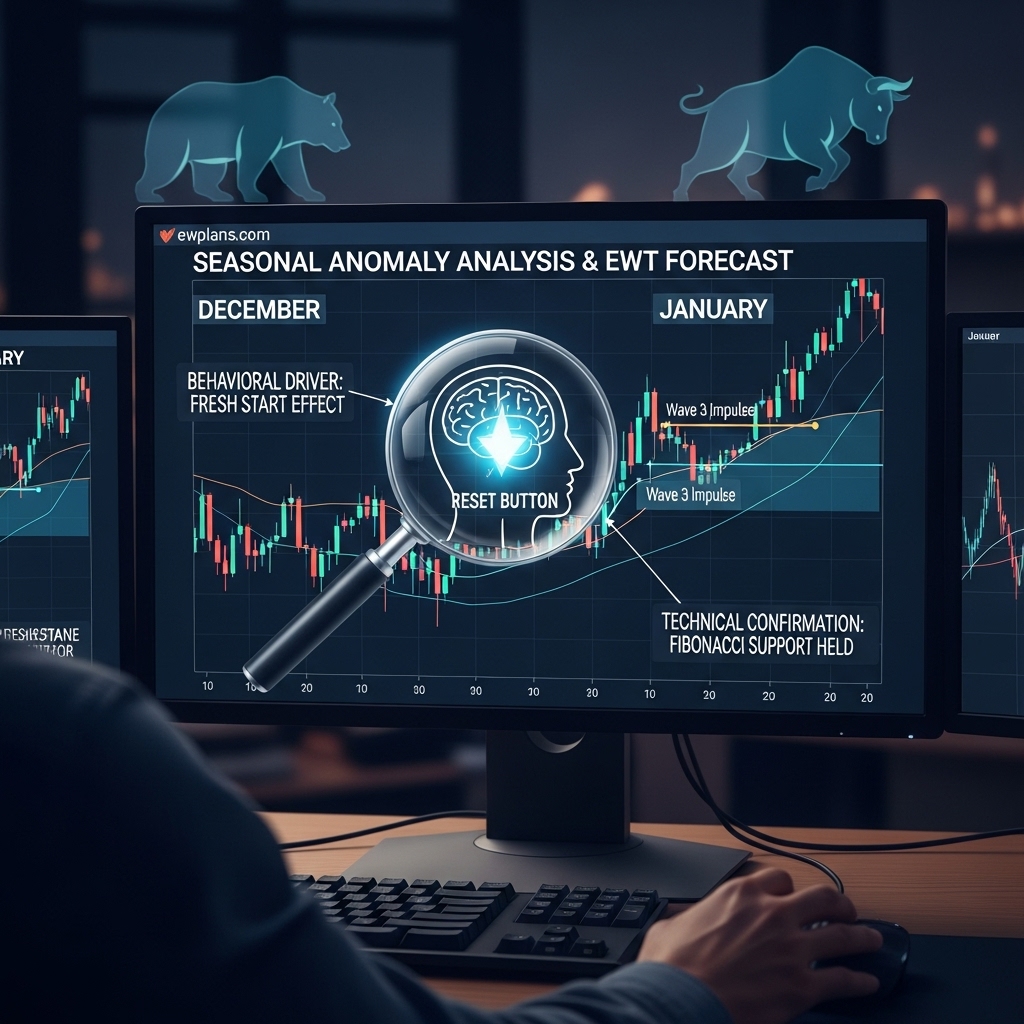
Behavioral Finance: The "Fresh Start Effect"
A major factor behind year-end uncertainties is human psychology. The "Fresh Start Effect" describes how people tend to focus on new goals and distance themselves from past mistakes at temporal landmarks like New Year's Day.
Psychological Reset and Investor Motivation
For investors, January 1st serves as a "psychological reset," where failed trades are left behind and portfolios are cleaned.
- Cognitive Distance: Calendar boundaries allow individuals to separate their "past imperfect self" from their "future ideal self".
- High-Level Construal: Fresh starts encourage big-picture thinking, leading investors to focus on long-term bullish scenarios rather than minor technical hurdles.
However, this wave of motivation can sometimes merge with "False Hope Syndrome," leading to a fade in enthusiasm by late January. At ewplans.com, we differentiate between seasonal excitement and genuine trend changes by mapping these emotional cycles to Elliott wave degrees.
Year-End Analysis by Asset Class
Year-end uncertainty manifests differently across various financial instruments.
Parities (Forex)
In currency markets, late December is often a period for closing "Carry Trade" positions and central bank year-end balance sheet adjustments.
- Dollar Index (DXY): While DXY often retreats at year-end, the "January Barometer" is a key determinant of its annual performance.
- Majors (EURUSD, GBPUSD): Sharp spikes during night sessions due to low liquidity can trigger "Leading Diagonal" structures in Elliott counts.
Indices
Indices like the S&P 500 and NASDAQ are the primary stages for the "Santa Claus Rally." While 2024 and 2025 showed varied results, institutional rebalancing remains a key driver. In Elliott terms, year-end peaks are often labeled as 5th wave extensions.
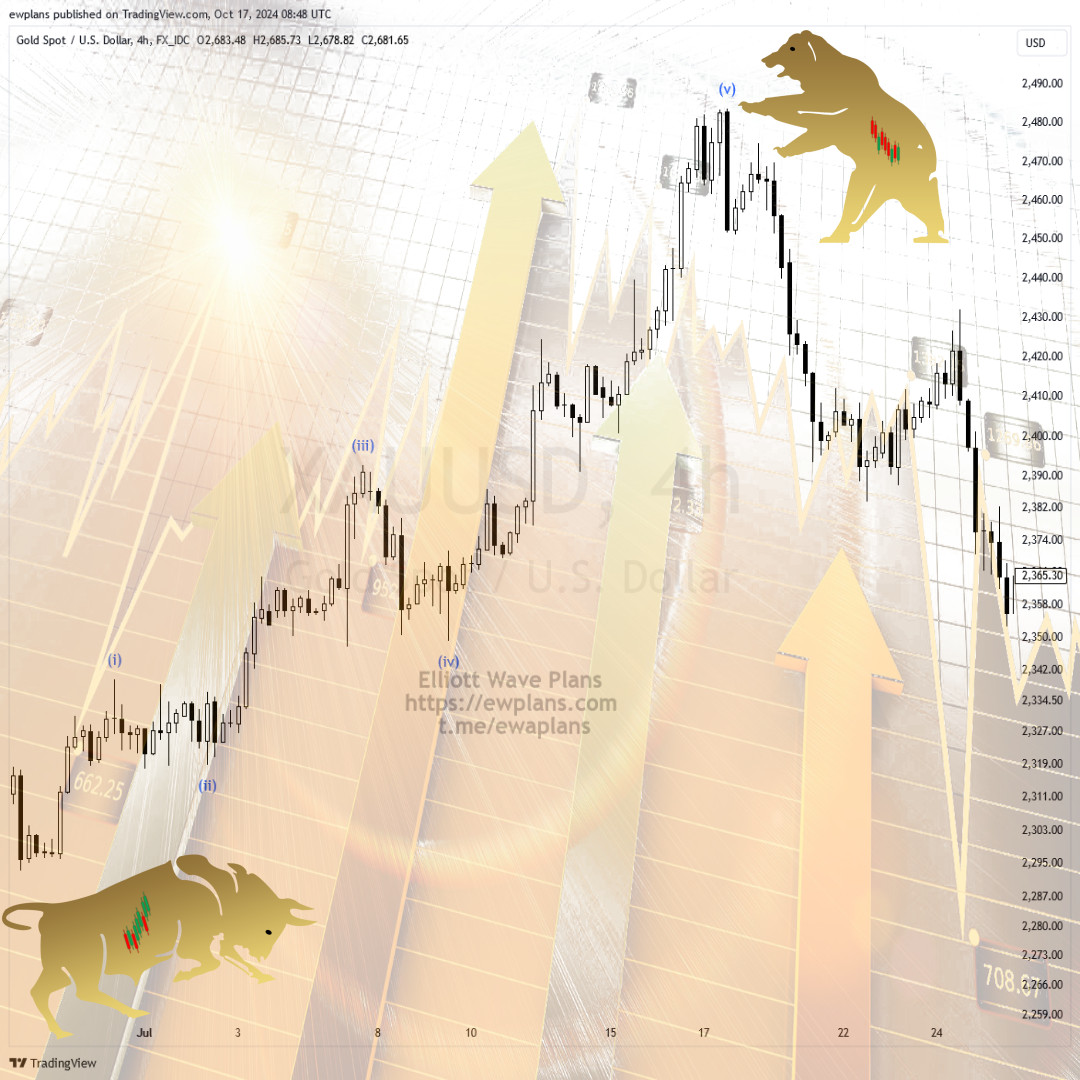
Commodities (Gold and Silver)
Precious metals move volatilely due to inflation expectations and interest rate sensitivities. Historically, Gold tends to show a positive bias in January. ewplans.com interprets XAUUSD movements in this period as the completion of "ABC" corrections and the start of new impulse waves.
Crypto Assets
Bitcoin and Ethereum are most affected by year-end liquidity shocks due to their 24/7 market nature.
- Crypto Seasons: The market is divided into "Spring, Summer, Fall, and Winter" based on Bitcoin halving cycles.
- ETF Impact: The approval of spot Bitcoin ETFs (like IBIT) has altered year-end dynamics, creating more consistent institutional flows.
- Volatility: Combined with leverage, liquidity gaps in crypto can lead to sudden 10-20% candles.
|
Crypto Season |
Description |
Avg Duration |
Elliott Wave Equivalent |
|
Spring |
Trough to halving process. |
17 Months |
Waves 1 and 2 |
|
Summer |
Halving to prior peak. |
5 Months |
Wave 3 (Start) |
|
Fall |
Prior peak to new peak. |
10 Months |
Wave 3 Ext / Wave 5 |
|
Winter |
Bear market and profit-taking. |
13 Months |
Major ABC Correction |
Strategic Recommendations and Risk Management
To navigate the "stormy" waters of year-end, a professional approach is mandatory. ewplans.com provides the following core principles for its users :
- Reduce Position Sizes: Due to the risk of slippage in low liquidity, trading with half your normal risk protects your capital.
- Stick to Fibonacci Levels: When price movement is uncertain, mathematical support and defense levels (0.618, 0.382) are the only true anchors in the market.
- Beware of False Breakouts: A resistance break during Christmas week often results in a "Bull Trap" if not supported by volume. Wait for volume confirmation.
- Incorporate Time Analysis: Elliott Wave Theory analyzes time as well as price. Fibonacci time sequences help predict potential turning points.
Conclusion: Harmonic Order Within Chaos
In conclusion, the "uncertain movements" at the turn of the year are an inevitable intersection of the market's mechanical structure and human psychology. While low liquidity challenges technical structures, Elliott Wave Theory allows us to see the order hidden within this chaos. The analyses on the ewplans.com platform treat these seasonal cycles not as obstacles, but as significant opportunities when read correctly.
While January serves as a barometer for the rest of the year, the Santa Claus Rally tests the internal strength of the market. For investors, the most important rule is to view this volatility not as a personal attack, but as the market's natural "breathing" process. Combined with disciplined wave counting, accurate Fibonacci ratios, and the motivation of the fresh start effect, catching the first impulse waves of the new year becomes a tangible goal.
Markets never truly sleep, but they do slow down at year-end. This slowdown is a strategic retracement and an accumulation phase for the grand waves of the coming year. Catching this harmonic rhythm with ewplans.com is the key to financial success.
Ewplans Teams