Hang Seng Elliott Wave Analysis: Wave iv Triangle Complete at 24,325 — Wave v Targets 26,187
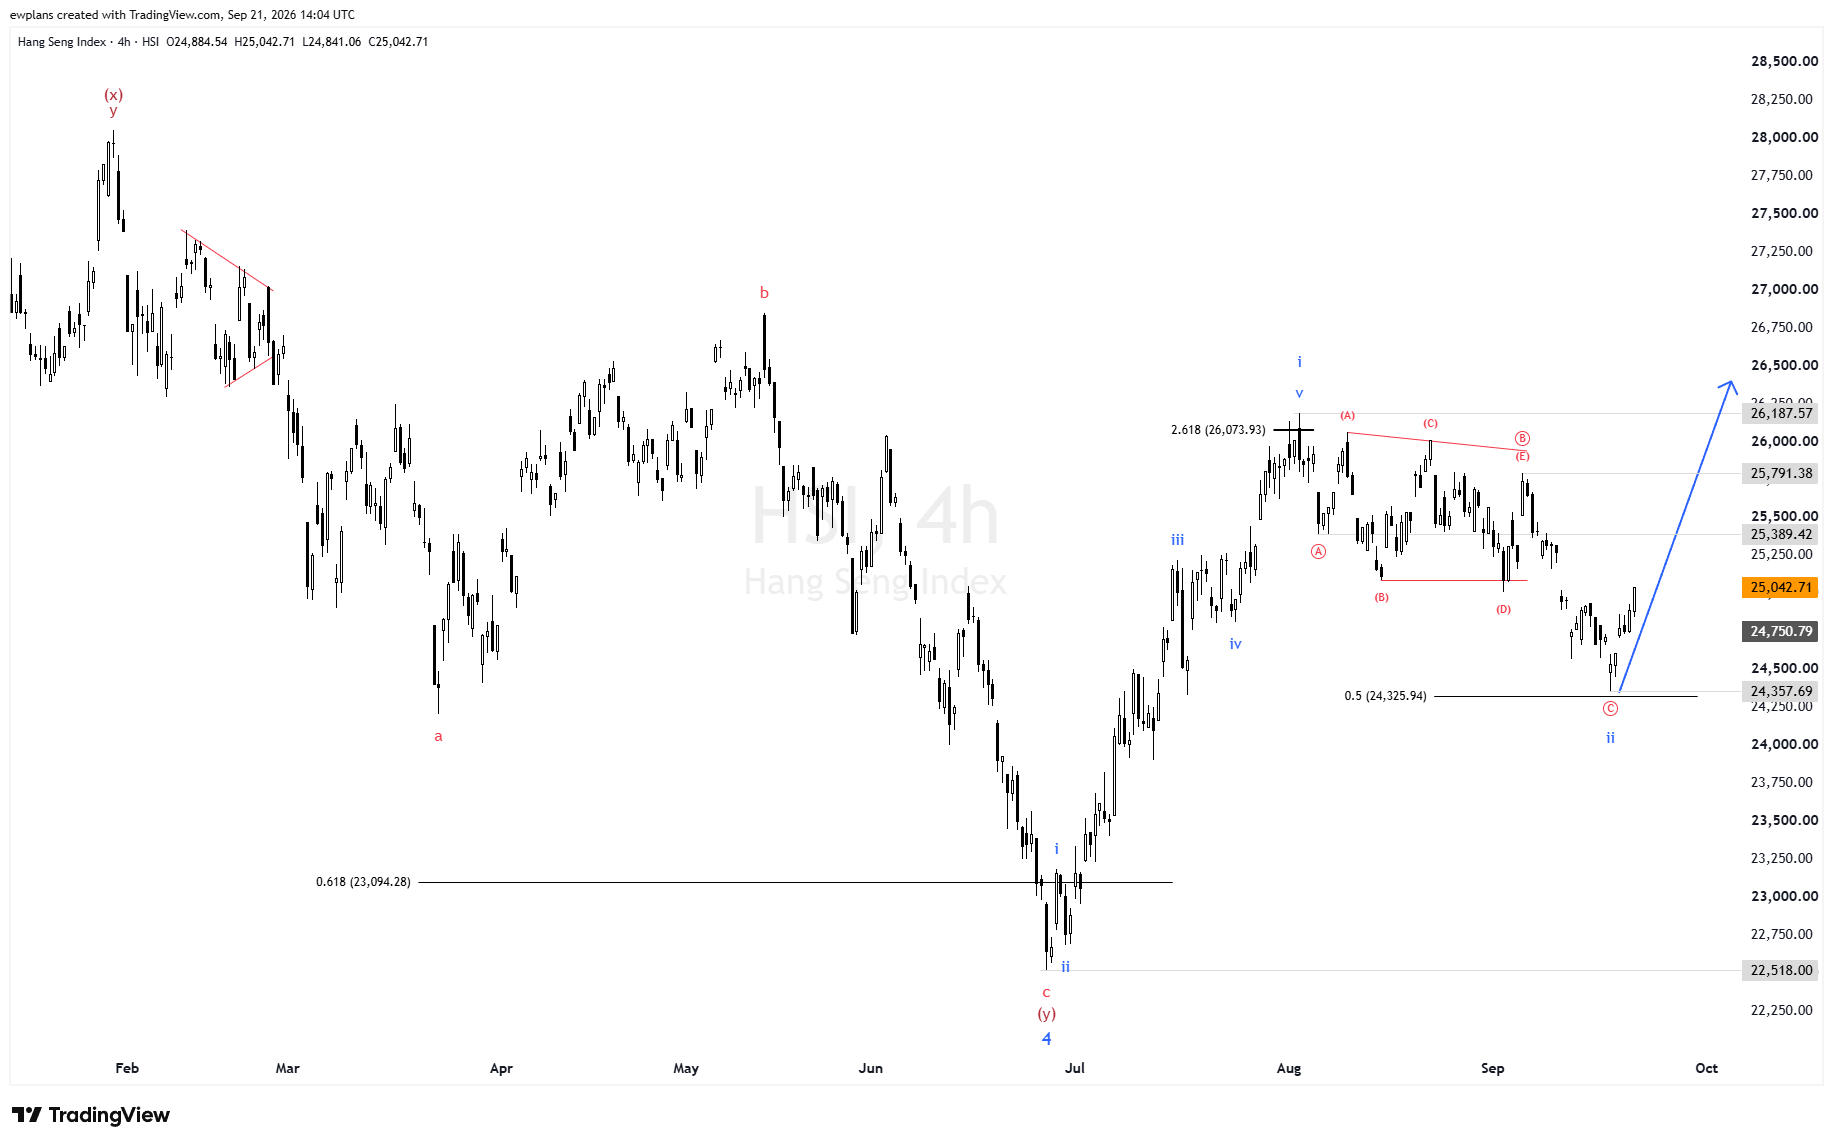
The Hang Seng Index is presenting one of the most structurally compelling Elliott Wave setups in Asian equity markets right now. After a major c/(y)/4 structural base at the 0.618 Fibonacci near 23,094 and a five-wave advance with Wave iii hitting the 2.618 Fibonacci at 26,073.93, the index formed a textbook A-B-C-D-E contracting triangle as Wave iv — completing precisely at the 0.5 Fibonacci near 24,325. Wave v has now launched from that triangle terminal, and the structural target is 26,187. Here is the complete breakdown.
Elliott Wave Analysis: Where Is HSI Right Now?
Critical Levels and Wave Count
The HSI H4 Elliott Wave picture for September 2026 is built on a multi-month structural foundation that traces to one of the most significant lows in the Hang Seng's 2026 trading history.
Prior Corrective Context — The (x)/y and a-b-c Structure:
The chart's upper left shows a prior corrective phase labeled (x) and y — with a descending red correction channel and internal a and b labels — establishing the corrective context that preceded the major structural bottom.
The c/(y)/4 Major Structural Base — 0.618 Fibonacci at 23,094:
Following the corrective advance to the b high near 26,800 in May, the index entered a sharp corrective decline that drove to the c/(y)/4 structural low near the 0.618 Fibonacci at 23,094.28 — labeled c, (y), and 4 on the EWPlans chart. This multi-degree terminal convergence confirms the 23,094 level as the major structural base for the entire bullish sequence.
The Five-Wave Bullish Impulse from 23,094:
From the 23,094 structural base, a five-wave bullish impulse developed:
i wave: The initial thrust from the structural low toward approximately 23,300 — labeled i on the chart.
ii wave: The corrective retracement from the i wave high, pulling back toward approximately 22,900–23,000 — labeled ii on the chart.
iii wave: The most powerful advance — labeled iii on the chart — driving HSI from the ii wave low to the 2.618 Fibonacci at 26,073.93 — labeled 2.618 (26,073.93) on the EWPlans chart. The precision of the iii wave terminating at the 2.618 Fibonacci is one of the strongest structural confirmation signals in this entire analysis — confirming both the wave count quality and the Fibonacci measurement framework.
iv wave — A-B-C-D-E Contracting Triangle (COMPLETE):
From the iii wave high near 26,073, Wave iv developed as a textbook A-B-C-D-E contracting triangle — one of the most analytically significant corrective patterns in Elliott Wave theory:
(A) wave: Initial decline from the iii high toward approximately 24,400 — labeled (A) on the chart
(B) wave: Counter-trend rally within the triangle toward approximately 25,389 — labeled (B) on the chart
(C) wave: Corrective decline to approximately 25,389–25,500 zone — labeled (C)
(D) wave: Recovery toward approximately 24,750 — labeled (D)
(E)/©/ii wave: The terminal wave of the contracting triangle, declining toward the 0.5 Fibonacci at 24,325.94 — labeled (E), ©, and ii on the chart, confirming the multi-degree terminal significance of this completion point
The (E) wave touching the lower trendline of the contracting triangle near the 0.5 Fibonacci at 24,325 provides the highest-quality structural trigger for Wave v — the triangle's terminal (E) wave completing at a key Fibonacci level is the most reliable pre-impulse signal in Elliott Wave analysis.
v Wave — NOW ACTIVE:
From the (E)/©/ii terminal at approximately 24,325, Wave v has launched. Current price at 25,042 is already 717 points above the triangle terminal, advancing with the momentum characteristic of a Wave v thrust from a contracting triangle. The primary target for Wave v is 26,187.57 — shown by the blue arrow on the EWPlans chart.
The Contracting Triangle Wave iv — The Most Reliable Pre-Impulse Pattern
The A-B-C-D-E contracting triangle that formed as Wave iv in HSI deserves specific attention as one of the most analytically significant patterns in the current chart:
1. Contracting triangles in Wave iv position are the highest-reliability pre-impulse patterns. In all of Elliott Wave theory, the contracting triangle in a fourth-wave position is the single most reliable pre-fifth-wave signal. Its appearance confirms: the prior iii wave was genuine; the triangle is the corrective pause; and only Wave v remains. When this pattern appears with the precision visible in HSI's Wave iv, the analytical confidence in Wave v is at its maximum.
2. The triangle's (E) wave completing at the 0.5 Fibonacci adds structural precision. The 0.5 Fibonacci at 24,325 providing the terminal support for the (E) wave — and turning price back up from that precise level — creates a dual confirmation: the contracting triangle structure AND the Fibonacci precision both simultaneously signal that Wave iv is complete and Wave v has begun.
3. The iii wave at 2.618 Fibonacci validates the count's Fibonacci quality. The iii wave terminating at the 2.618 Fibonacci at 26,073 is the prior Fibonacci confirmation in this sequence. When a third wave hits a Fibonacci extension with this precision, the fourth and fifth waves that follow typically maintain the same structural Fibonacci quality — elevating confidence in the Wave v target at 26,187.
4. Wave v from a triangle iv is typically fast and decisive. In Elliott Wave sequences where Wave iv is a contracting triangle, the Wave v thrust that follows is characterized by strong initial momentum and typically reaches its target more rapidly than the prior waves did. This is because the triangle's compression loads directional energy for the thrust.
Expected Scenario and Potential Moves
Current Phase — Wave v advancing toward 26,187:
HSI at 25,042 is advancing with approximately 1,145 points remaining to the 26,187 primary target. Key resistance levels on the way up:
25,389: (B) wave reference — first resistance
25,791: Structural resistance
26,073: iii wave high (2.618 Fibonacci) — major resistance to clear before 26,187
26,187: Wave v primary target — the blue arrow destination
After Wave v completion near 26,187:
Once Wave v completes near 26,187, the entire five-wave bullish sequence from the 23,094 structural base will be complete. The Elliott Wave framework would then shift to assessing the corrective structure that follows — and what larger-degree wave context that would establish for HSI's medium-term outlook.
Key structural reference points:
26,187.57: Wave v primary target — blue arrow destination
26,073.93: iii wave high / 2.618 Fibonacci — major resistance
25,791.38: Structural resistance
25,389.42: (B) wave / resistance reference
25,042.71: Current price — Wave v advancing
24,357.69: (E)/©/ii terminal
24,325.94: 0.5 Fibonacci — Wave iv completion / strong support
22,518.00: Deep structural support / Invalid Level
23,094.28: 0.618 Fibonacci / c/(y)/4 base — ultimate structural floor
Strategic Perspective for Traders
1. The contracting triangle Wave iv is the most structurally credible pre-Wave v signal in Asian equity markets right now. The textbook A-B-C-D-E formation, the (E) wave touching the 0.5 Fibonacci at 24,325, and the launch of Wave v from that precise terminal create a three-layer structural confirmation that is rarely seen with this level of precision.
2. The 26,073 iii wave high is the key intermediate level before 26,187. As Wave v advances toward 26,187, the prior iii wave high at 26,073 (the 2.618 Fibonacci) is the first major structural resistance. A decisive close above 26,073 would confirm Wave v is accelerating toward the 26,187 target with full momentum.
3. The 24,325 triangle (E) low is the structural anchor for Wave v. For any bullish positioning based on Wave v, the (E)/(©)/ii low at 24,325 is the structural support reference. A return below this level would challenge the Wave v launch reading.
4. China macro and regional risk sentiment are the primary external variables. HSI is highly sensitive to Chinese economic data, PBOC policy signals, and broader regional risk appetite. Any significant Chinese macro disappointment or escalation of regional geopolitical tensions could temporarily suppress Wave v momentum. However, as long as 23,094 holds, the larger bullish structure remains intact.
5. Wave v at 26,187 from the current 25,042 represents approximately 4.6% additional upside — a measurable and achievable advance for an equity index Wave v thrust following a contracting triangle.
Conclusion — Follow HSI's Wave Structure With EWPlans
The Hang Seng Index is executing one of the most structurally precise Elliott Wave setups in Asian equity markets. Wave iii hit the 2.618 Fibonacci at 26,073 with precision. Wave iv formed a textbook A-B-C-D-E contracting triangle completing at the 0.5 Fibonacci near 24,325. And Wave v — the final bullish thrust targeting 26,187 — has launched from that triangle terminal. The contracting triangle is the most reliable pre-impulse pattern in Elliott Wave theory, and HSI has just delivered a textbook example.
At EWPlans, we publish H4 and D1 Elliott Wave analysis on the Hang Seng Index and 38 other instruments every single day. Our EWP Nexus-powered wave counts give equity index traders the structural precision to track Wave iv triangle completions and position for Wave v advances across the most consequential global index markets.
👉 Get daily wave counts for HSI and 38 more instruments — Start Your Analysis at EWPlans.com