Free Charts

Free Elliott Wave Chart Library

Preview EWPlans market structure updates with snapshot-based Elliott Wave notes across forex, metals, indices and crypto. Use these free charts to study scenarios, invalidation logic and key levels before choosing a full analysis package.

SOL/USD Elliott Wave Analysis: Wave (iv) c-Leg Nears Completion at 84–85 — Rebound Toward 100.5 Mapped
H4 SOLUSD

SOL/USD Elliott Wave Analysis: Wave (iv) c-Leg Nears Completion at 84–85 — Rebound Toward 100.5 Mapped

Solana’s (iv) correction is nearing completion around 84–85, with a rebound toward 100.5 mapped.

Latest Free Updates

Browse Market Setups

240 charts

US100 Elliott Wave: Nasdaq 100 Elliott Wave Analysis: Wav
H4 NAS100 Elliott Wave Analysis
US100

US100 Elliott Wave: Nasdaq 100 Elliott Wave Analysis: Wav

NAS100 Wave ③ peaked at the 1.618 Fib 30,881 — the Wave ④ correction to 30,059 is the structural buy zone before Wave ⑤ drives to new highs above 30,881.

Read analysis
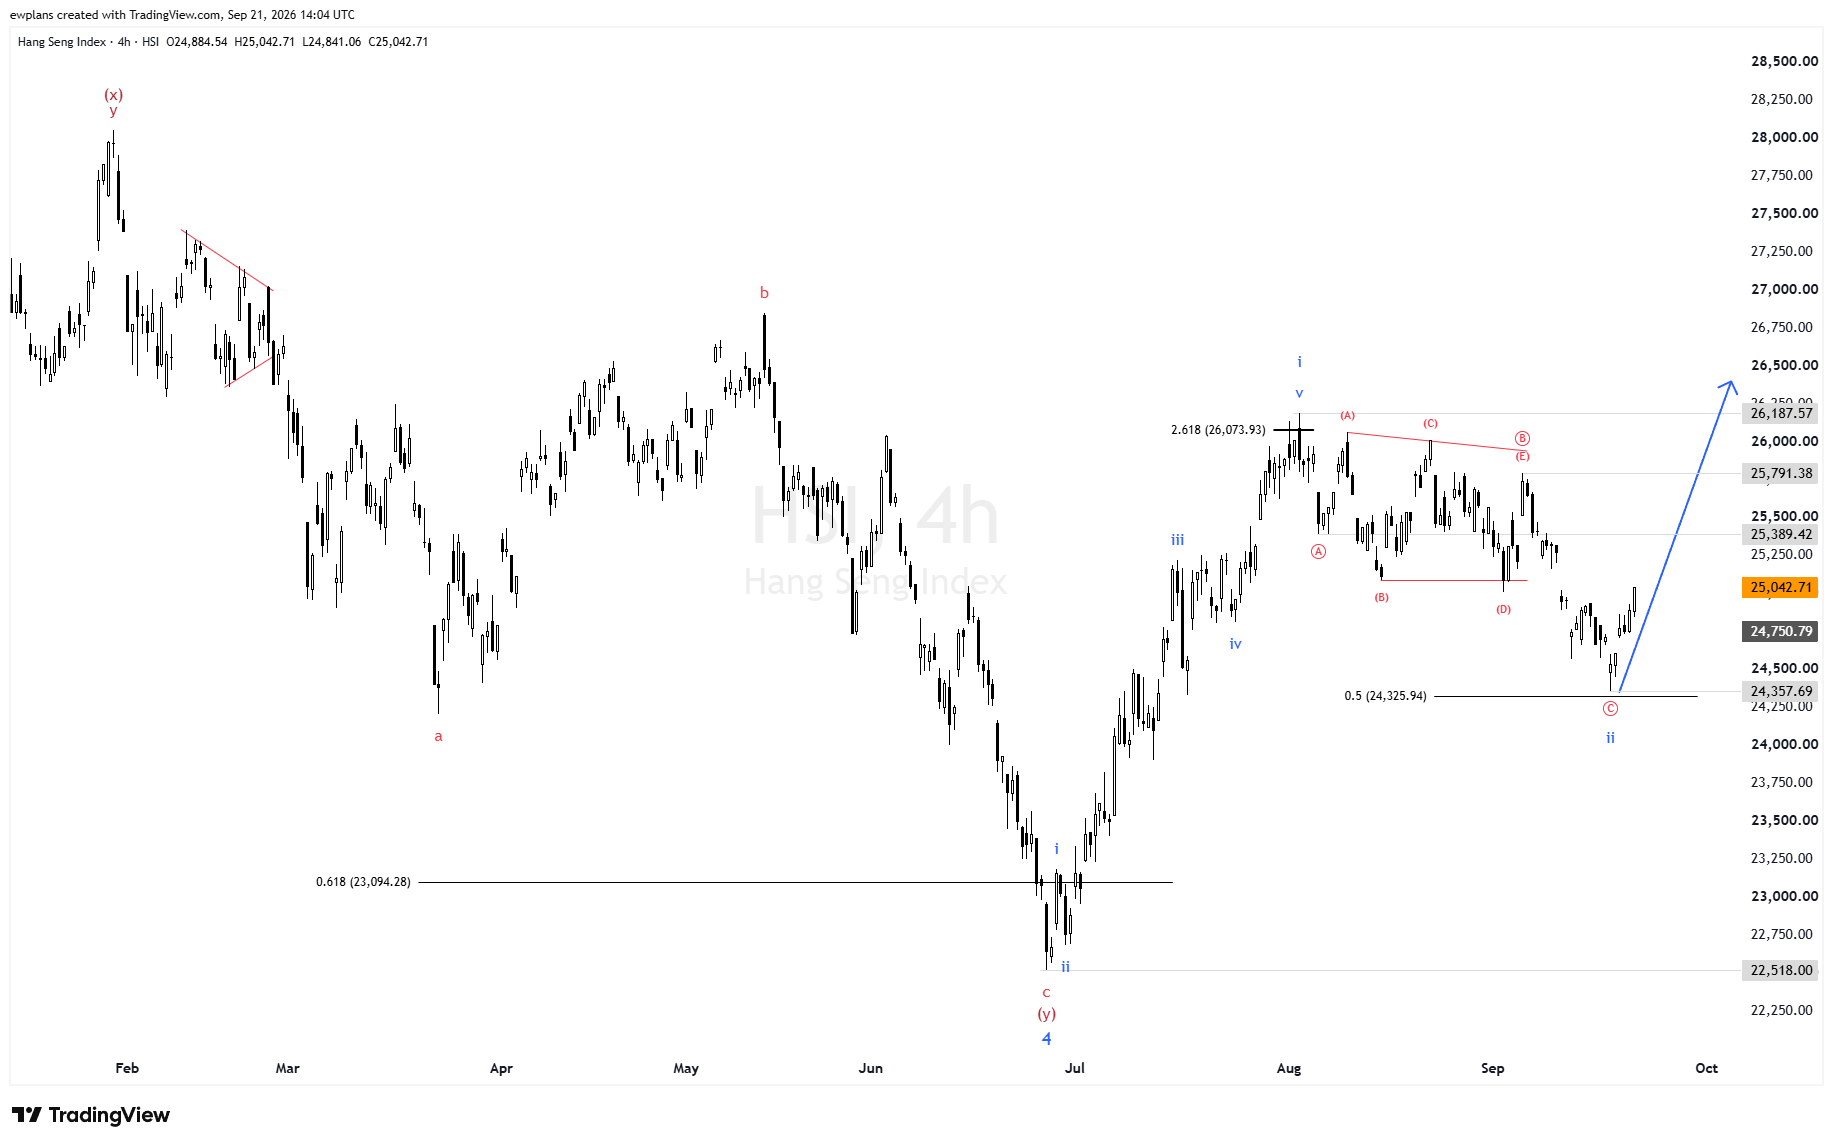
HSI Elliott Wave: Hang Seng Elliott Wave Analysis: Wave i
H4 Hang Seng Elliott Wave Analysis
HSI

HSI Elliott Wave: Hang Seng Elliott Wave Analysis: Wave i

HSI Wave iv contracting triangle completed at 0.5 Fib 24,325 — Wave v has launched toward 26,187 in the final bullish thrust of this Elliott Wave sequence.

Read analysis
XAUUSD Elliott Wave: BTC/USD Elliott Wave Analysis
H4 BTC/USD Elliott Wave Analysis
XAUUSD

XAUUSD Elliott Wave: BTC/USD Elliott Wave Analysis

Bitcoin Wave ⑤ is advancing from the $74,913 base — a decisive break above the $82,281 x-level opens the 1.618 Fib target at $90,903.

Read analysis
GBPUSD Elliott Wave Analysis: H4 Count (Sep 2026)
H4 GBP/USD Elliott Wave Analysis
GBPUSD

GBPUSD Elliott Wave Analysis: H4 Count (Sep 2026)

GBP/USD Wave C is declining toward 1.3427–1.3360 after A and B complete — these are the structural buy zones before the next major bull run above 1.3658.

Read analysis
EURJPY Elliott Wave Analysis: H4 Count (Sep 2026)
H4 EUR/JPY Elliott Wave Analysis
EURJPY

EURJPY Elliott Wave Analysis: H4 Count (Sep 2026)

EUR/JPY W-X-Y correction is nearly complete — the Y-wave targeting ~178.00 is the structural buy zone before the next major bullish impulse above 187.95.

Read analysis
AUDUSD Elliott Wave Analysis: H4 Count (Sep 2026)
H4 AUD/USD Elliott Wave Analysis
AUDUSD

AUDUSD Elliott Wave Analysis: H4 Count (Sep 2026)

AUD/USD Wave ③ peaked at 0.7238 — the Wave ④ c-leg correction to 0.7051–0.7007 is the structural buy zone before Wave ⑤ drives the pair to new highs.

Read analysis
BTCUSD Elliott Wave Analysis: H4 Count (Sep 2026)
H4 BTC/USD Elliott Wave Analysis
BTCUSD

BTCUSD Elliott Wave Analysis: H4 Count (Sep 2026)

Bitcoin Wave ③ peaked at 82,281 — Wave ④ W-X-Y (y)-leg is targeting ~76,453 as the structural buy zone before Wave ⑤ launches to 84,000+.

Read analysis
USDJPY Elliott Wave Analysis: H4 Count (Sep 2026)
H4 USD/JPY Elliott Wave Analysis
USDJPY

USDJPY Elliott Wave Analysis: H4 Count (Sep 2026)

USD/JPY Wave b completed at 160.72 — Wave c is actively targeting the 0.5 Fibonacci at 151.935 as the final corrective leg in the A-B-C structure.

Read analysis
EURUSD Elliott Wave Analysis: H4 Count (Sep 2026)
H4 EUR/USD Elliott Wave Analysis
EURUSD

EURUSD Elliott Wave Analysis: H4 Count (Sep 2026)

EUR/USD Wave iv contracting triangle is complete at ~1.1640 — Wave v is now targeting the 2.618 Fibonacci at 1.1521 as the final leg of Wave (3).

Read analysis
USOIL Elliott Wave: WTI Oil Elliott Wave Analysis: Wave ②
H4 WTI Oil Elliott Wave Analysis
USOIL

USOIL Elliott Wave: WTI Oil Elliott Wave Analysis: Wave ②

WTI Oil Wave ② hit the 0.618 Fib at $78.79 precisely — Wave ③ is now advancing toward the 1.618 Fib at $101.71, with crude oil targeting triple digits in this Elliott Wave sequence.

Read analysis
XAUUSD Elliott Wave Analysis: H4 Count (Sep 2026)
H4 XAU/USD Elliott Wave Analysis
XAUUSD

XAUUSD Elliott Wave Analysis: H4 Count (Sep 2026)

Gold Wave b is rallying toward 4,538–4,608 after Wave a completed at ~4,283 — once b tops, Wave c targets the 4,202–4,160 structural completion zone.

Read analysis
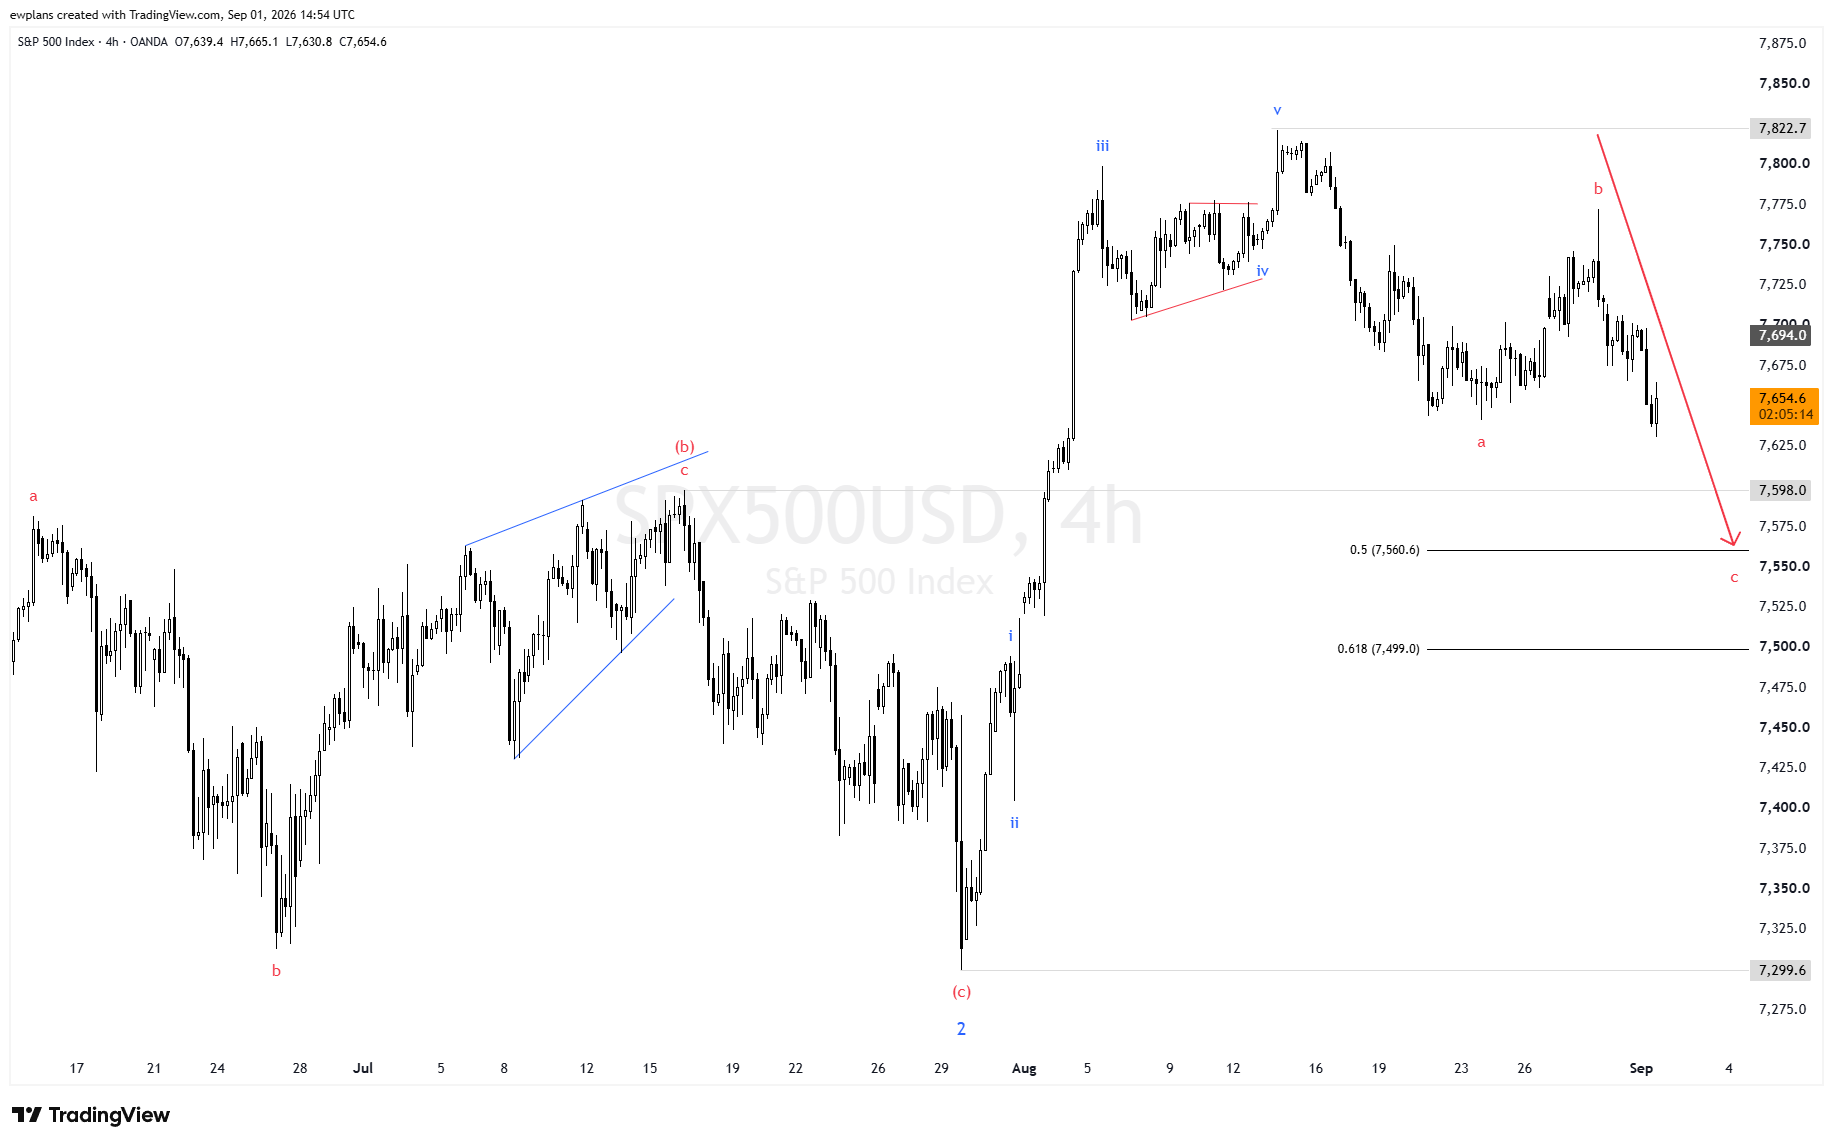
US500 Elliott Wave: S&P 500 Elliott Wave Analysis: Wave ②
H4 S&P 500 Elliott Wave Analysis
US500

US500 Elliott Wave: S&P 500 Elliott Wave Analysis: Wave ②

S&P 500 Wave ② c-leg is heading for 7,560–7,499 — this is the structural buy zone before Wave ③ drives the index to new highs above 7,822.

Read analysis
Risk Notice

Disclaimer

The information provided on www.ewplans.com is for educational and informational purposes only and solely as a self-help tool for your own use. It is the responsibility of the viewer to first consult with a trusted financial advisor or other qualified financial professional before making any investment decisions.

While we strive to provide accurate and up-to-date information, we make no representations or warranties of any kind, express or implied, about the completeness, accuracy, reliability, suitability, or availability with respect to the website or the information, products, services, or related graphics contained on the website for any purpose. Any reliance you place on such information is strictly at your own risk.

The information provided on this website does not constitute investment advice, financial advice, trading advice, or any other sort of advice, and you should not treat any of the website content as such. EWPlans is not responsible for any loss caused by any information provided on the website. Investing and trading in financial markets or cryptocurrencies can be risky. You should conduct your own research when making any financial decisions.

EWP Nexus Support Ask about plans, access and EWPlans.