


Why News Headlines Can Be Deceiving
Many investors believe that the market moves solely based on economic data or breaking news. However, Elliott Wave Theory argues that price movements are actually a direct product of mass human psychology. News is often merely a catalyst that triggers a direction the market was already psychologically prepared to take. For a technical analyst, the news itself is not what matters; what truly matters is the market’s reaction to that news.
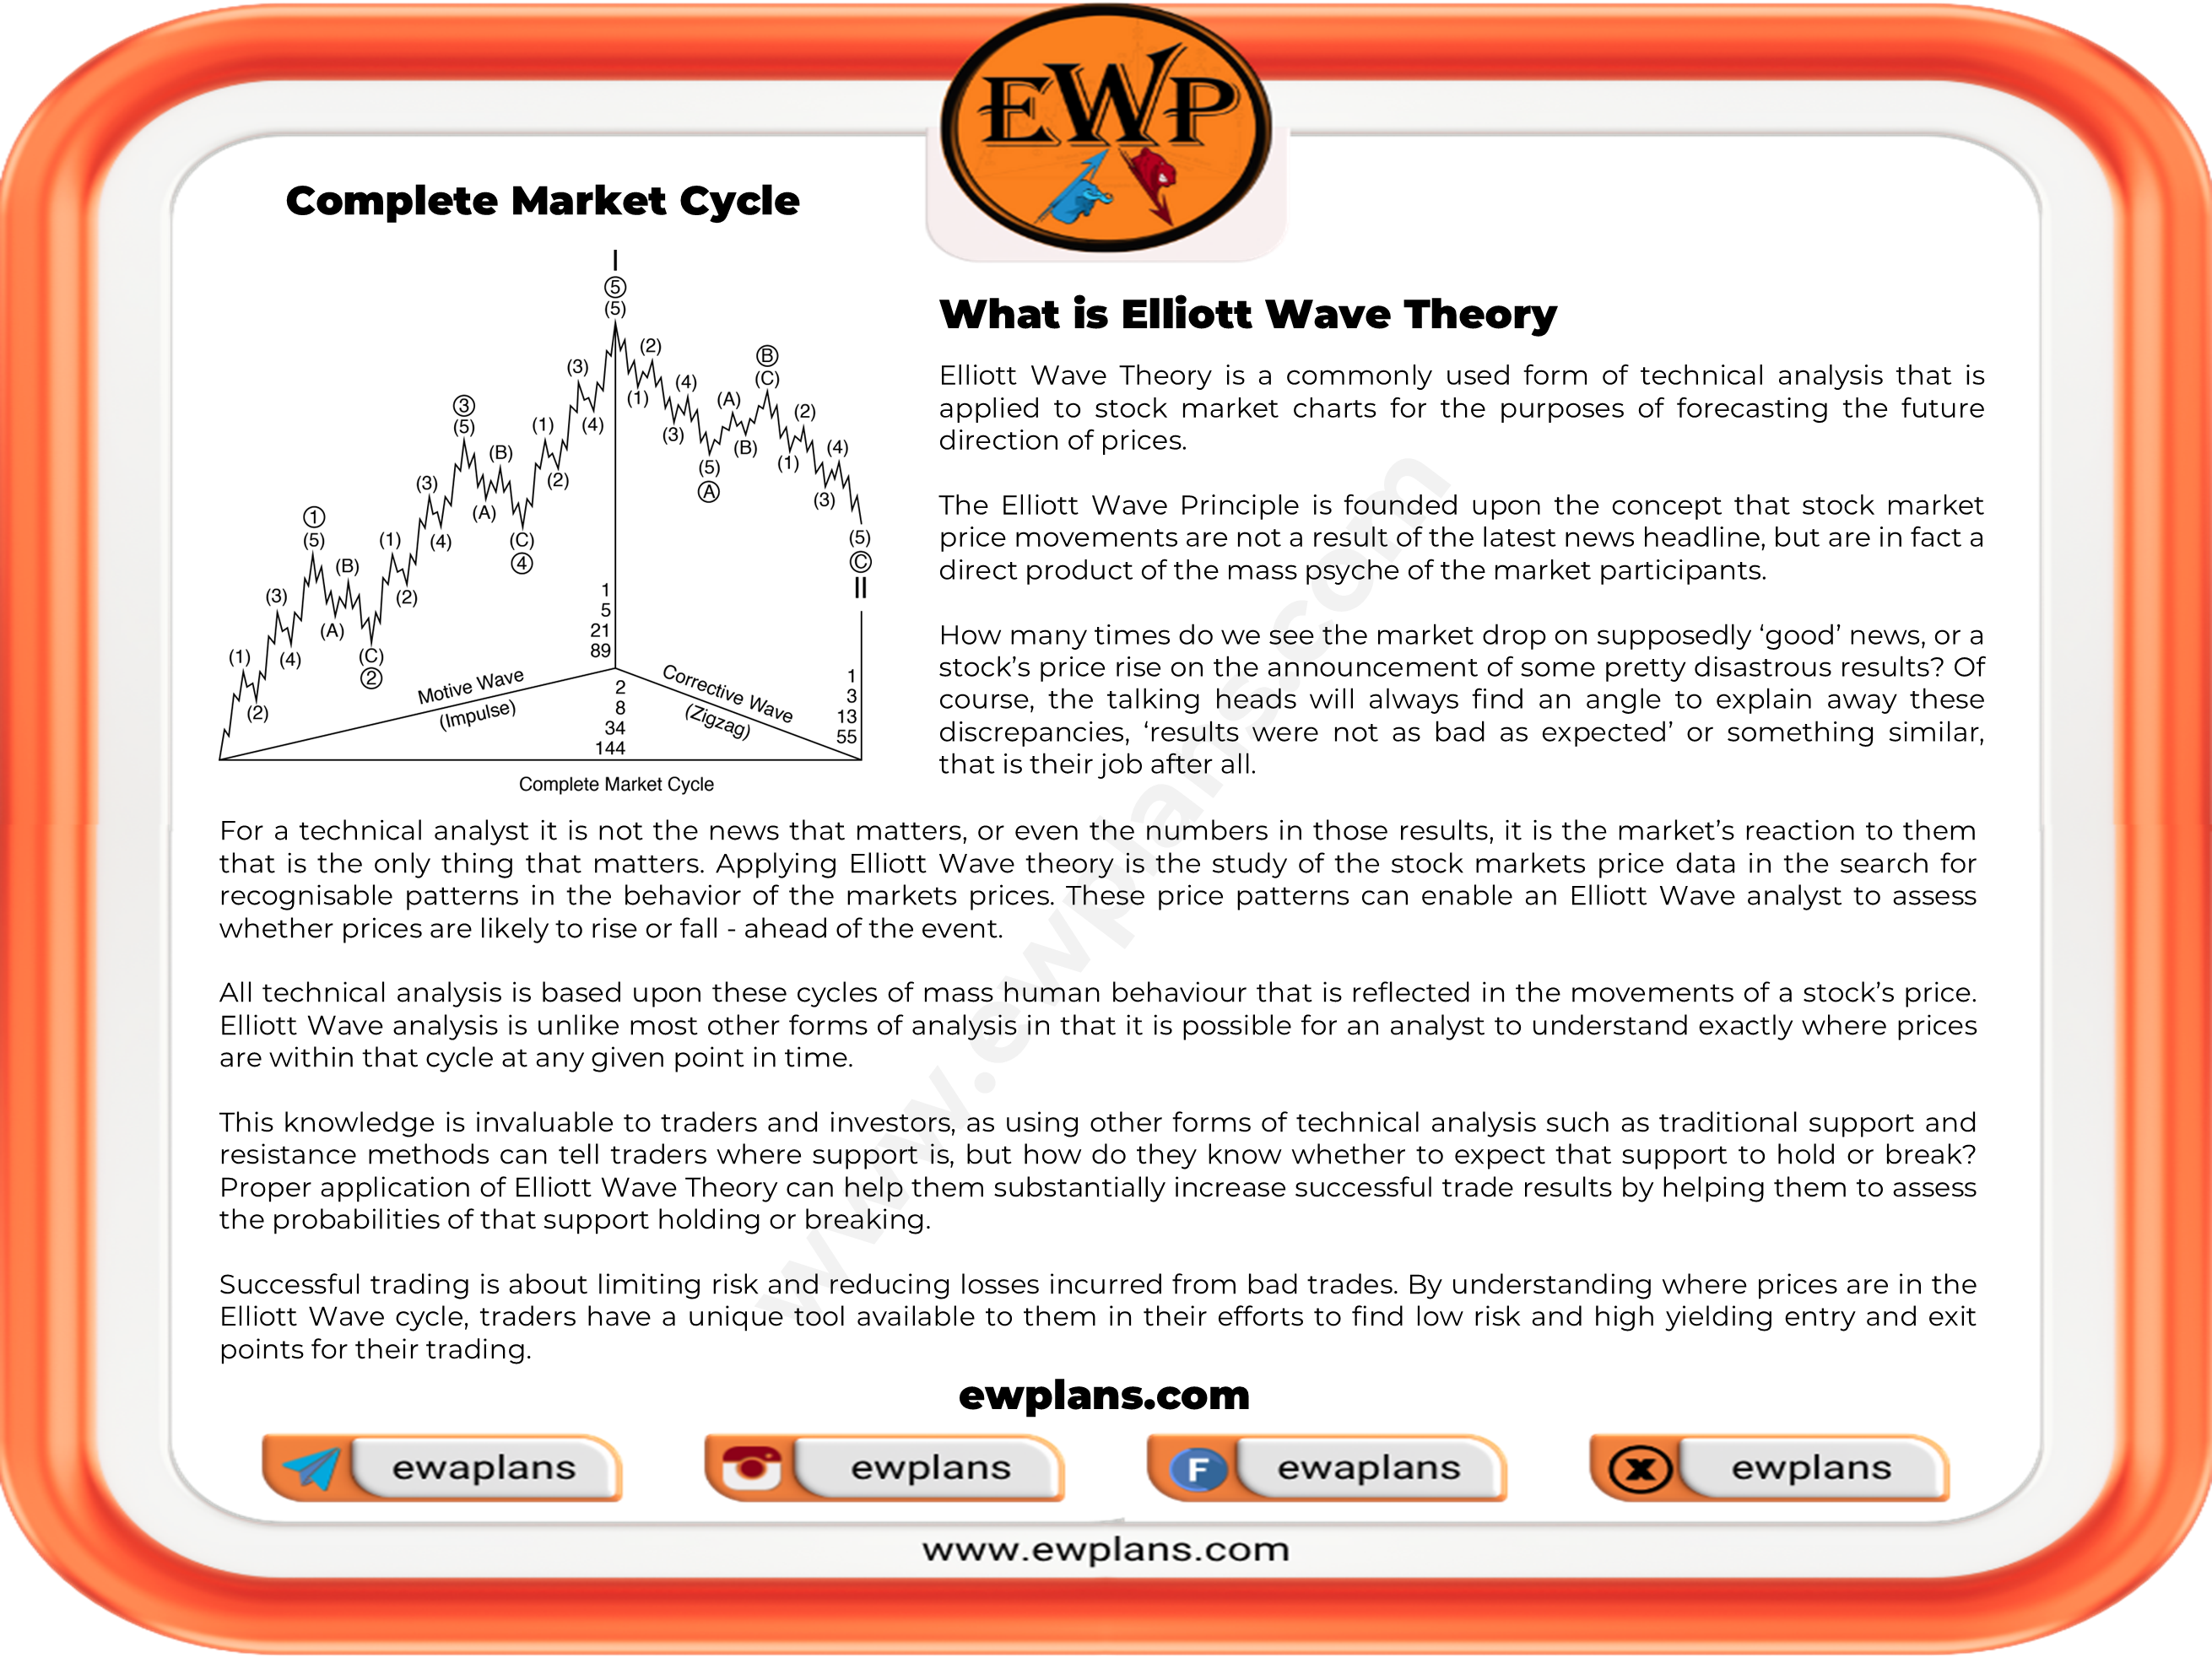
The Complete Market Cycle and Wave Structures
Elliott Wave analysis studies the market within specific cycles rather than as random chaos. Each stage in this cycle reflects the current mood of the market participants:
-
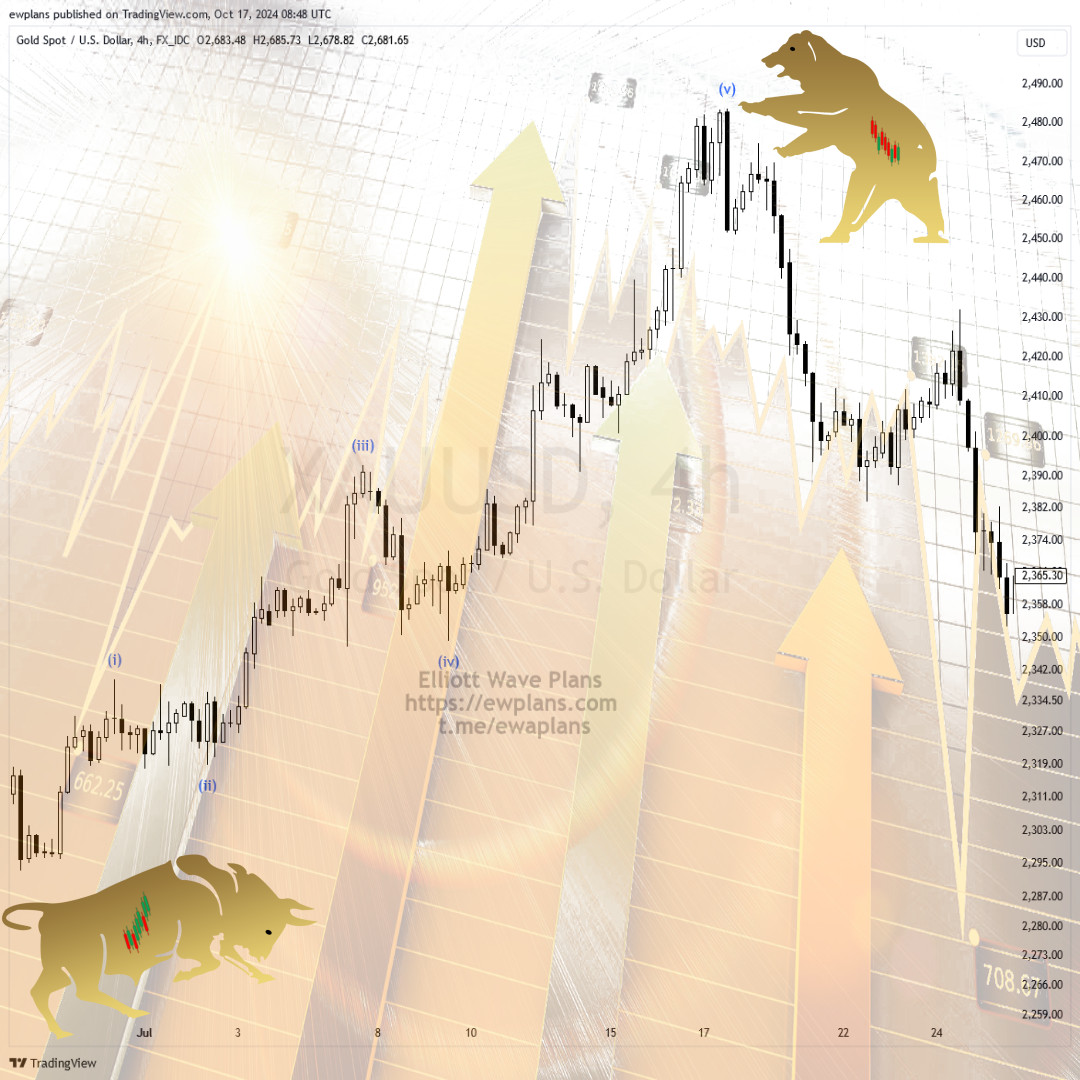
Motive (Impulsive) Waves: These are 5-wave structures that define the main direction of the trend, characterized by mass excitement and participation.
-
Corrective Waves: These are 3-wave structures (ABC) where profit-taking occurs and the market regathers strength for the next impulsive move.
Strategic Advantages for Traders
Unlike many other forms of technical analysis, Elliott Wave provides a unique framework to understand "exactly where" the price is within the current cycle. This knowledge allows a trader to assess not just where a support level is, but also the probability of that support holding or breaking. Successful trading is about limiting risk and identifying high-yielding entry and exit points. Understanding Elliott Wave cycles provides investors with an unparalleled tool to find these low-risk opportunities.
Frequently Asked Questions (FAQ)
| Question | Answer |
| Is Elliott Wave only applicable to stocks? | No; it can be applied to any liquid market where mass psychology is present, including Cryptocurrencies, Forex, and Commodities. |
| Why does the price sometimes drop on good news? | Because the market may have already priced in that news and transitioned into a "corrective" stage of the cycle. |
| What is the purpose of corrective waves? | They trim market excesses and provide the necessary liquidity for the main trend to continue. |
Author’s Note (EWP Strategy)
Elliott Wave is not just a forecasting tool; it is the art of reading probabilities. The "Complete Market Cycle" shown in our visuals should always remind you of the big picture. Remember, even the most powerful storms (like Wave 5) eventually give way to a period of calm (ABC correction). Define your strategy not by the size of the waves, but by the rhythm of the market.